
Bitcoin bulls may be feeling frustrated by the slow price action over the past few months. After hitting resistance at $30k, the Bitcoin price has moved in a very tight range compared to its historical volatility. This can be seen in the FX market too, where the EUR/USD has been climbing steadily over the pivotal 1.10 level, leaving traders wondering what comes next.
The two markets are connected, and when looking at the EUR/USD rally from 0.95 and comparing it to Bitcoin’s from $15,000, the similarities are clear. This suggests that it is more of a US dollar story than Bitcoin investors accumulating more coins.
To understand the situation better, let’s take a look at some technical indicators. Firstly, the Relative Strength Index (RSI) has been above 50 since the start of 2023, suggesting a bullish bias. The weekly chart also points to an ascending triangle pattern, which could lead to a move up to $45k, so long as the Bitcoin price remains above $25k.
The image below shows the Bitcoin chart:
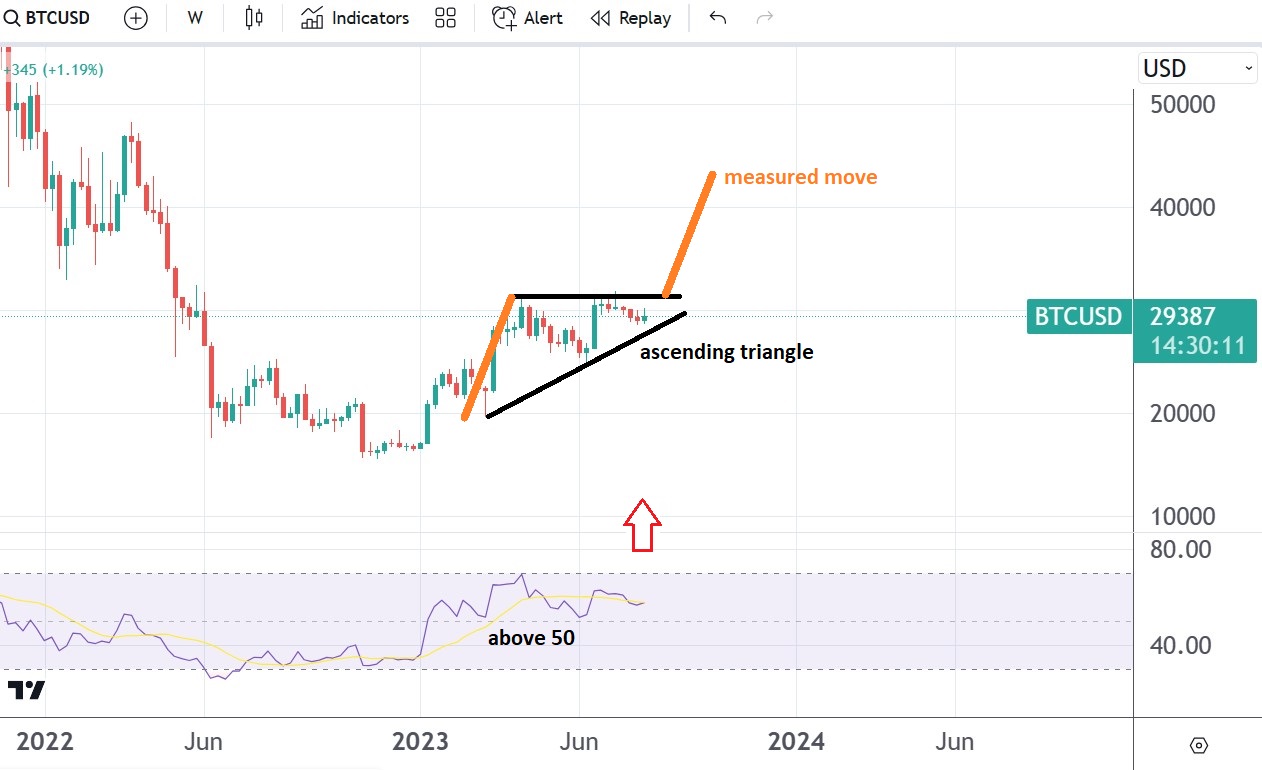
Bitcoin chart by TradingView
To summarise, current technical indicators suggest that the bias for Bitcoin price is bullish, and that it could move up to $45k, providing it holds above $25k.