
Ether is on a never-ending mission to break through the psychologically key $3K level. The DeFi leader breached the hurdle earlier and is now up 16% in the past week.
Ethereum 7-day returns, data from CoinMarketCap
Order Book
The $3K range has been a battleground for some time, and today is no different. The graph below from InToTheBlock shows the active volume on either side of $3K as the order book builds up with bids. It is hard to predict which way ETH is heading. Like most financial instruments, it is dependent on geopolitical happenings, which have been plentiful lately.
Order Volume beneath the $3K level. Data from InToTheBlock
Trading Volume
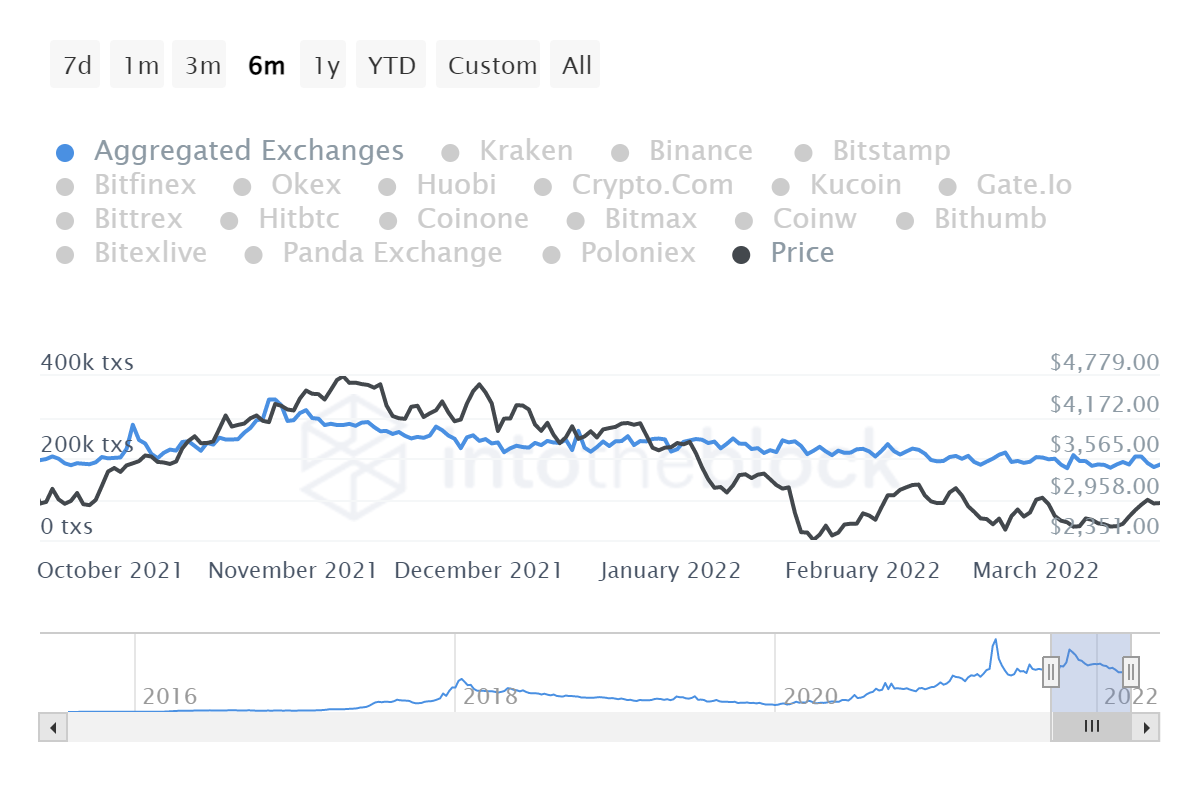
Volume is not a reliable indicator of trend as withdrawals from exchanges continue to decrease gradually. This suggests that hodlers are staying strong, regardless of the volatility. This month, the market has been influenced by Russia. Looking at the 30-day moving average, we can see that trades are now 3% lower than last month. This is not unexpected, but it is a significant signal that long-term holders are standing their ground.
Exit Data from InToTheBlock
BTC Correlation
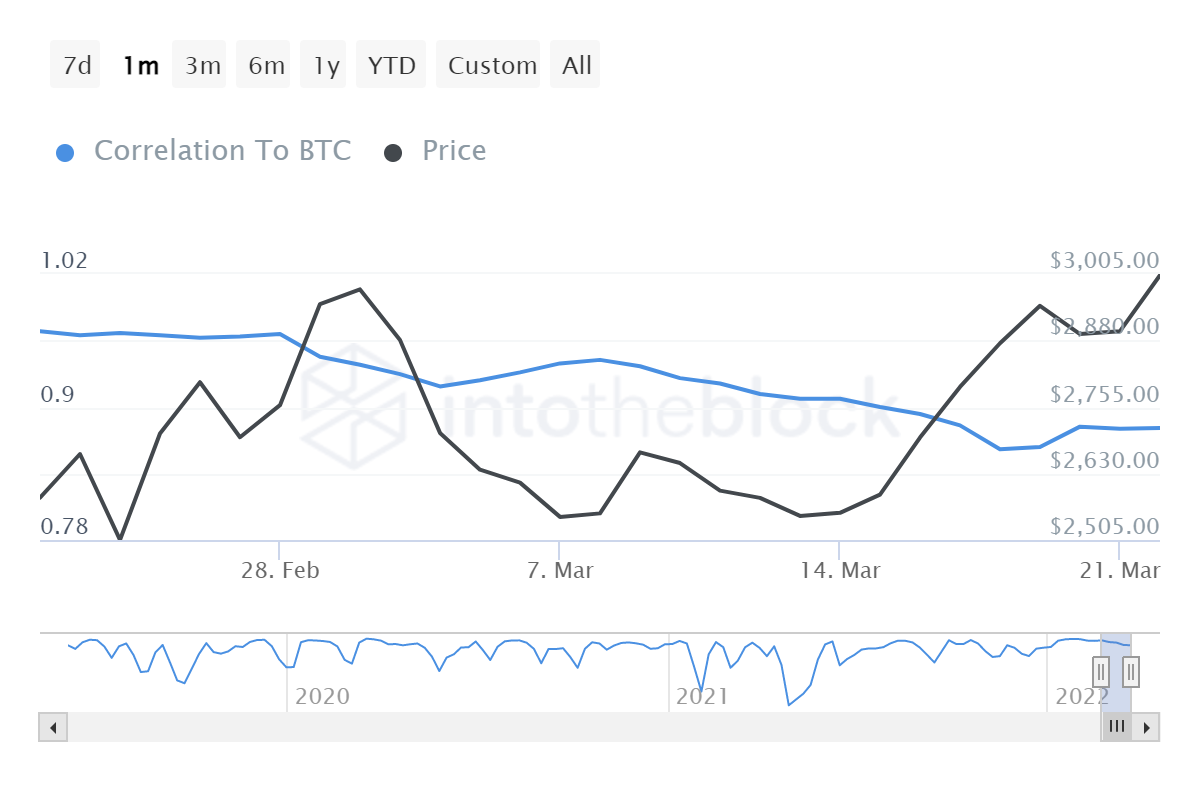
ETH has outperformed other digital assets by a substantial margin – in the past week, the world’s largest crypto gained only half of what ETH did in that same 7-day period, which was 8%. Looking at correlations, ETH has been gradually declining in the last month, but the correlation to Bitcoin remains very high at 0.88.
Thus, even though ETH supporters have been predicting a decoupling, that day has yet to come. With a market cap of $360 billion, ETH is still far behind BTC’s estimated $807 billion. Talk of a “Flippening” has also decreased. Nevertheless, with the much-anticipated launch of ETH 2.0 getting closer, I think that this summer could be a turning point. Expect discussions of a decoupling or an alteration in the trend to start up again. It will be interesting to observe how the two largest cryptos interact after ETH transitions to proof of stake.
 Data from InToTheBlock
Macro
On-chain metrics appear to be positive, but not outstanding. Perhaps the cause of the ETH surge can be found elsewhere. It may be tempting to point to one or more metrics, but they are only useful when taken in the context of the overall market. They should not be seen in isolation and should not be the only source of information in a forecast.
Frankly, even though ETH has increased in value, the financial markets experienced a very good week. We discussed Bitcoin, but stocks have also been performing well. The S&P 500 has risen by 8% as the market appears to be taking a more optimistic outlook on future events. ETH was able to take advantage of this momentum and go up.
The graph below illustrates the timing of Bitcoin, Ethereum, and stock prices over the past week.
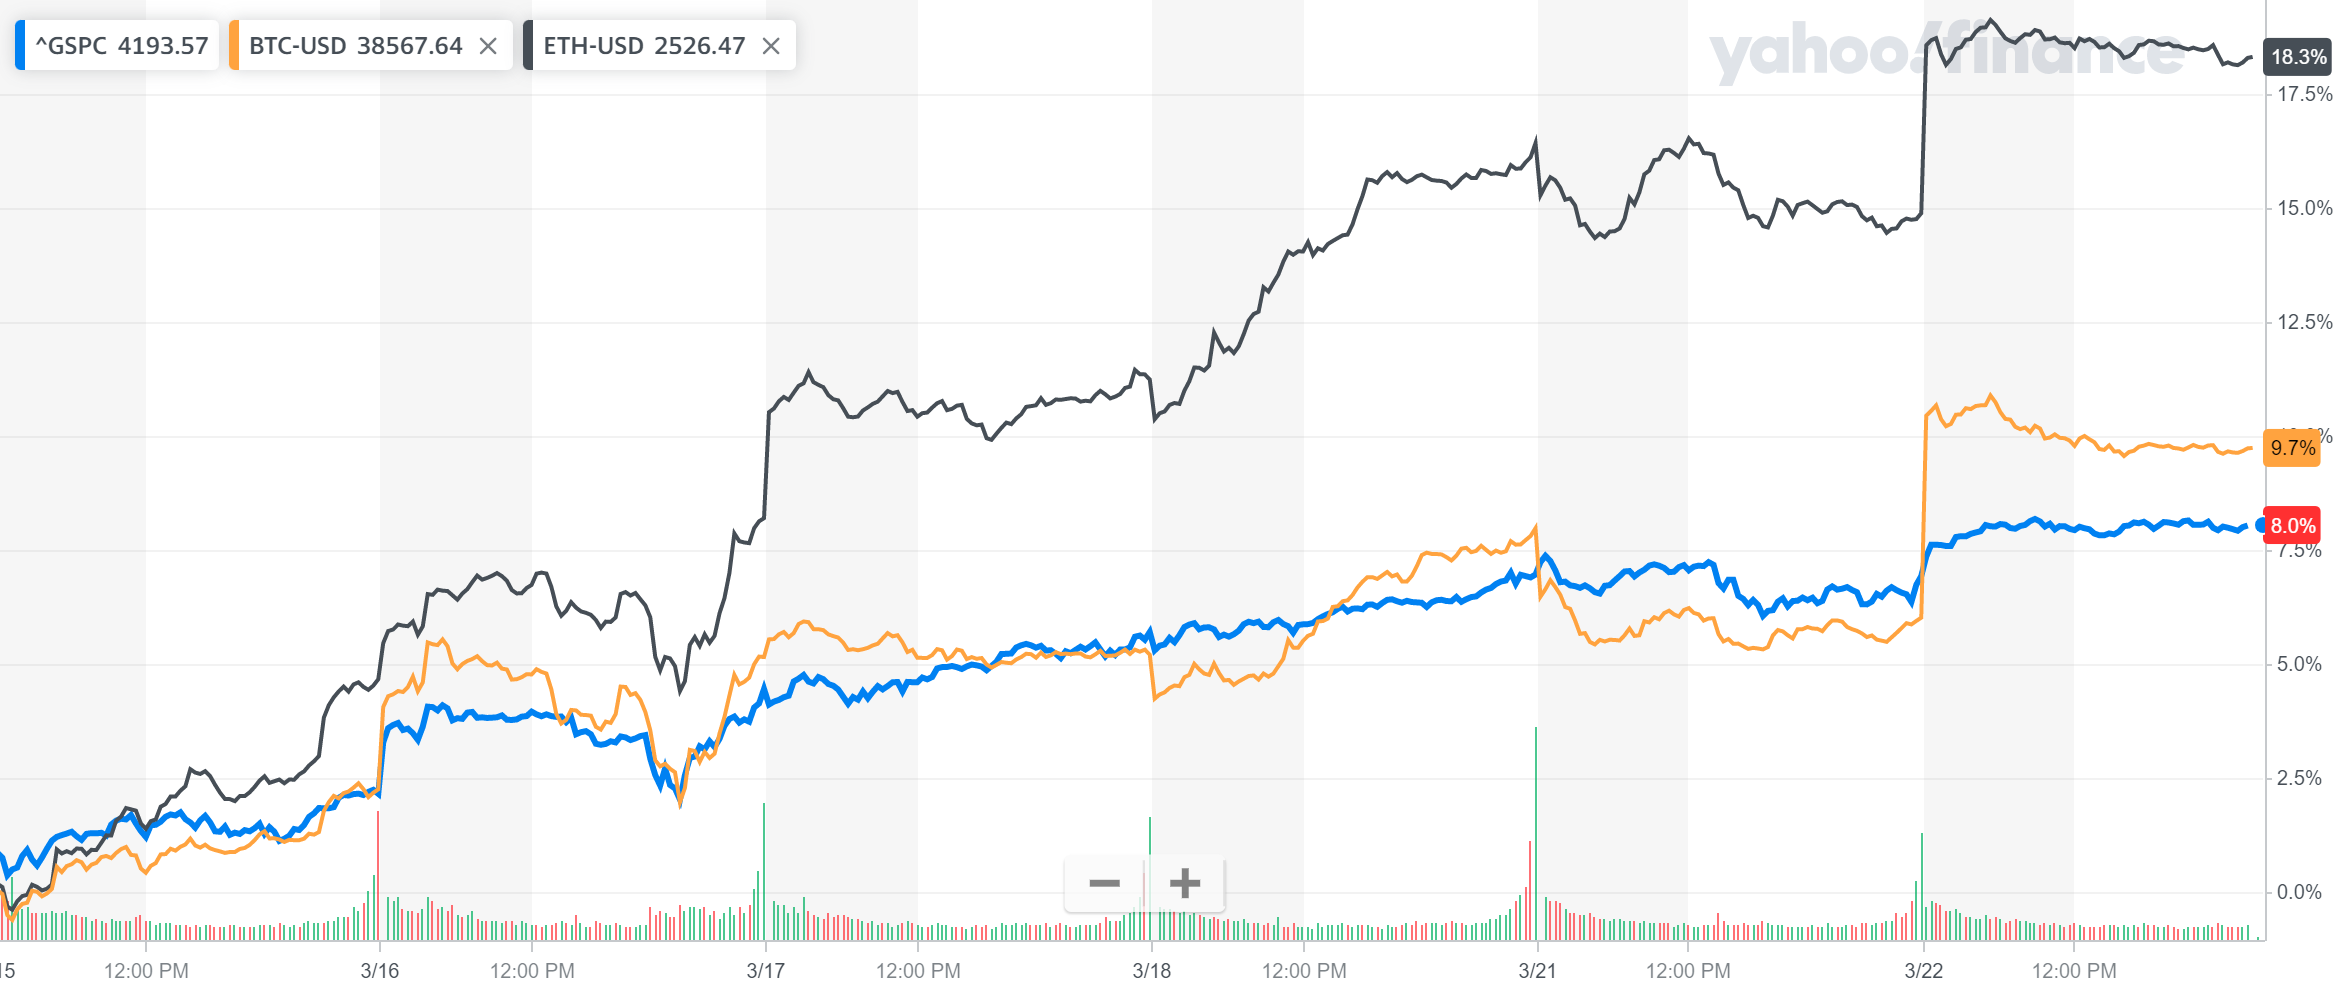
S&P 500 (blue), Bitcoin (orange). Ethereum (black) 7-day returns and data from Yahoo Finance
Conclusion
It was a strong week for Ethereum, with it outperforming all other cryptos and asset classes. ETH 2.0 has been a long, drawn out project for many, due to all the delays. But, as it gets closer, it will be