
- TRXUSD strives to break through the resistance at $0.07
- A double bottom pattern has formed at $0.05
- Bullish case is reinforced by inverse head/shoulders pattern
The cryptocurrency market recently experienced a bullish setup, with TRON’s TRX/USD currency pair attempting to break through the resistance at $0.07 and various bullish patterns in action.
Earlier in 2022, the market witnessed a bearish trend that lasted until the end of the year. Despite the bearish pressure, the bulls managed to prevent the market from making a new low.
The strength of the bullish case is only confirmed if the double top and inverse head-and shoulders patterns are accompanied by additional strength above the previous higher low.
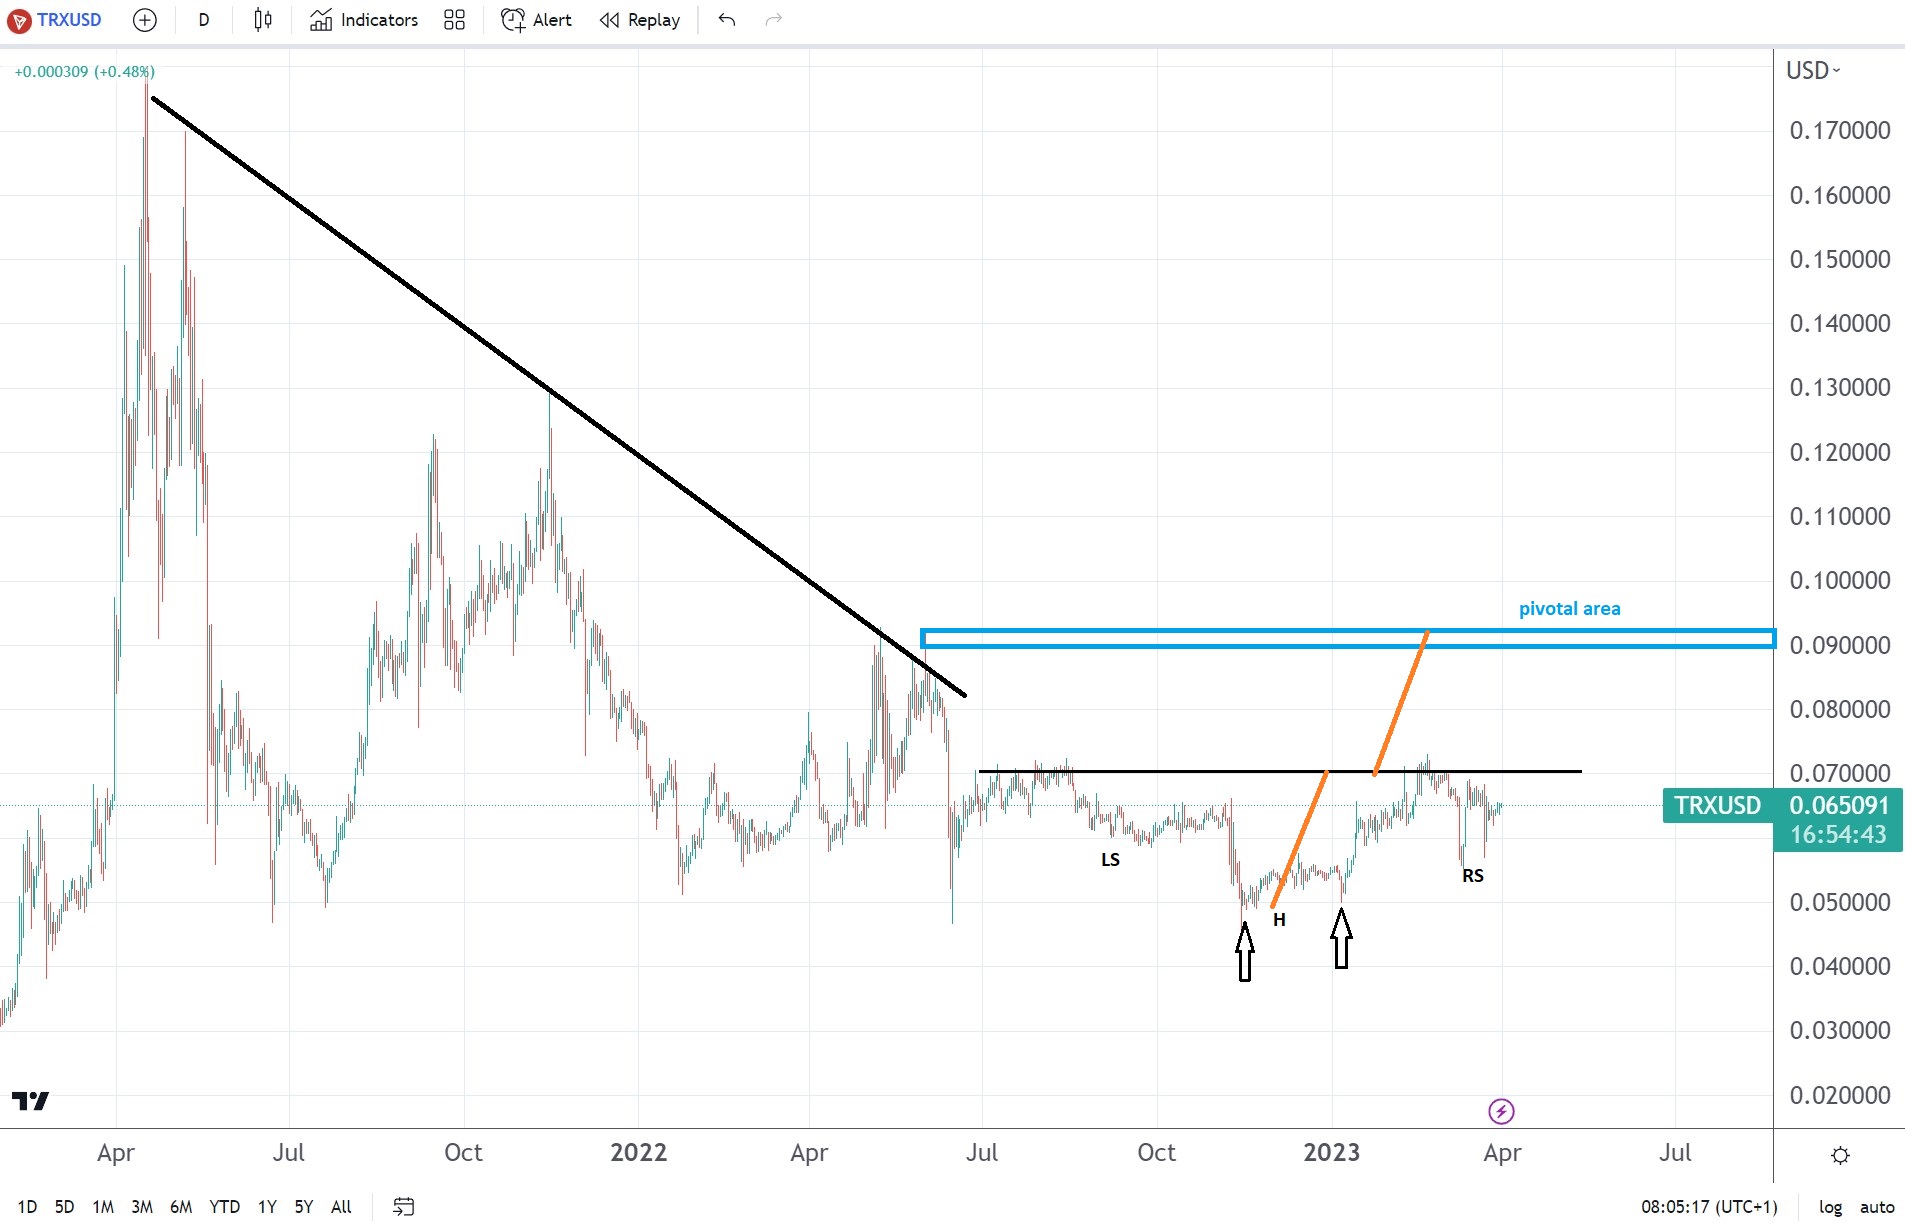
TradingView TRXUSD chart
Tron Double Bottom Pattern at $0.5
Towards the end of 2022, the Tron currency pair formed a double bottom. Bulls were unable to break through the $0.05 threshold.
This is a reversal pattern which signals the end of a bearish trend and is considered to be quite bullish. The measured move of this pattern corresponds to the measured move of another bullish pattern – the inverse head and shoulders.
Bullish Case Supported by Inverse Head and Shoulders
The inverse head and shoulders formation requires more time to complete. In this case, it took approximately six months and is still unfinished. For the bullish case to be confirmed, the price action must close above the neckline before progressing towards the orange measured move.
When multiple patterns point in the same direction, the market is said to be in a confluence zone. If TRX/USD can surpass $0.09 (a key region), then the bullish break will be validated. This will be an indication that the lower peak has been surpassed and more strength should follow.